Introduction
Equipment rarely stays at peak performance throughout its life. Process changes, component wear, fouling and poor operating habits gradually erode efficiency and output. Systematic performance optimization can recover lost efficiency, cut energy use, extend equipment life and defer capital replacement. This article covers proven strategies for optimizing the performance of pumps, valves, heat exchangers and other fluid equipment.
Establishing a Performance Baseline
Recording Initial Performance
Factory acceptance testing: establishes a performance baseline under controlled conditions, including verification of guaranteed duty points, recording of the full performance curve, efficiency measurement across the operating range, and recording of mechanical parameters such as vibration and temperature.
Site commissioning data: records initial performance as installed, including actual operating conditions, system curve verification, baseline vibration signatures and confirmation of power consumption.
Baseline data is the reference point for all later work: it is used to quantify performance loss, identify optimization opportunities, build the economic case for improvements and reveal degradation patterns through trend analysis.
Performance Monitoring
Common key performance indicators (KPIs) include actual flow versus specification, discharge pressure versus demand, power consumption per unit of output, overall equipment effectiveness, and availability and reliability metrics.
Monitoring frequency can be set at four levels: continuous logging of key parameters by modern control systems; weekly or monthly operator rounds recording performance data; quarterly detailed efficiency tests and vibration surveys; and an annual comprehensive performance audit.
Trend charts reveal that a gradual drop in efficiency usually means wear or fouling; step changes often match specific events such as component failure or modifications; seasonal swings point to external factors; and correlations between parameters help identify cause and effect.
Hydraulic Performance Optimization
Optimizing the Operating Point
System curve analysis: measure the actual flow and head at the current operating point, calculate the system curve as H = H_static + K × Q², and compare it with the design system curve to decide whether the operating point needs adjusting.
Running near the best efficiency point: centrifugal pumps should run at 80%–110% of best efficiency point (BEP) flow; control valves should sit at mid-travel (40%–70% open) at design flow; heat exchangers should run at design flow for the best heat transfer coefficient.
There are three main ways to adjust the operating point:
- Impeller trimming: reduce impeller diameter to lower flow permanently and move the operating point left toward BEP.
- Speed control: use a variable frequency drive (VFD) to set the operating point precisely.
- System modification: change system resistance, such as pipe size or valve settings, to shift the system curve.
Impeller and Trim Optimization
Wear assessment: visually inspect for erosion, corrosion and cavitation damage; measure dimensions and compare them with new-part specifications; measure clearances such as wear ring and side clearances.
Replacement decisions: an original-design impeller restores as-new performance; an upgraded impeller with improved hydraulics can raise efficiency by 2%–5%; a trimmed impeller permanently reduces output without throttling losses.
Modern hydraulic retrofits: flow passages optimized with computational fluid dynamics (CFD), advanced blade geometry that reduces turbulence, and anti-recirculation features that improve part-load efficiency are all worth considering.
Seal and Bearing Optimization
Mechanical seal upgrades: cartridge seals are easier to install and more reliable than component seals; silicon carbide faces in place of softer face materials extend life and reduce friction; API Plan 32 (external flush) in place of Plan 11 (internal recirculation) reduces heat generation.
Bearing improvements: angular contact bearings carry more thrust than deep groove ball bearings; hybrid bearings with ceramic rolling elements last longer in contaminated environments; synthetic oils and high-performance greases lower friction losses.
Seal and bearing losses typically account for 1%–3% of input power. Modern designs can recover 25%–50% of this, equal to an efficiency gain of 0.5–1.5 percentage points.
System-Level Optimization
Multiple Pump Systems
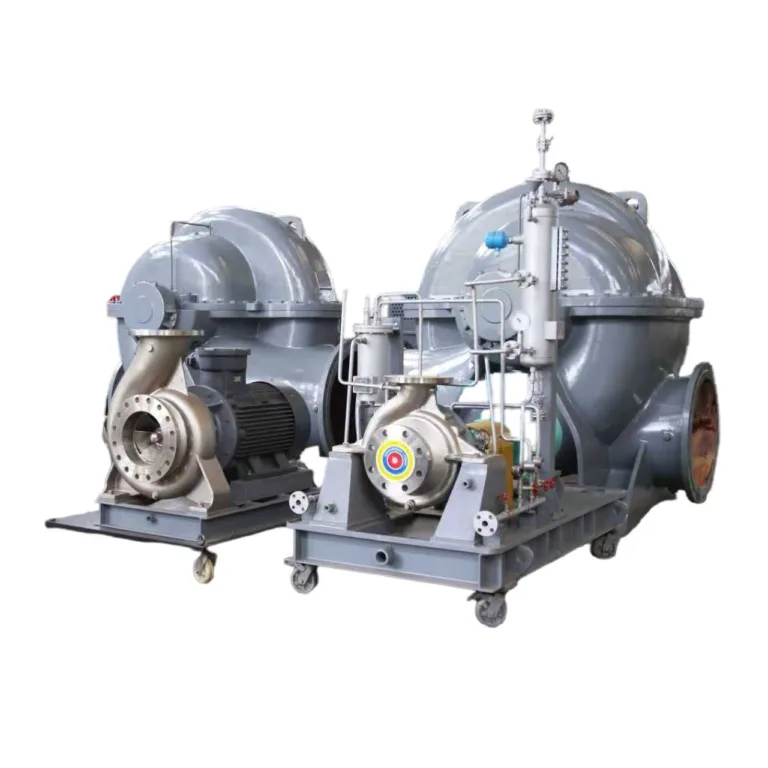
Parallel operation: choose pumps with similar performance curves to share load evenly; run the fewest pumps needed for demand to avoid inefficient part-load operation; combine one VFD pump with several fixed-speed pumps to optimize overall system efficiency.
Series operation: bring the second pump on only after the first reaches its capacity limit, and make sure total head is shared sensibly between stages.
Eliminating Throttling Losses
A throttled control valve dissipates energy as heat, which is pure loss. Alternatives include variable speed drives that match pump speed to actual demand; impeller trimming that permanently reduces flow without a throttling valve; and multiple pump staging, whose output steps follow the load curve more closely than a single pump.
In economic terms, throttling loss power can be estimated as ΔP × Q / efficiency. In continuous duty with varying load, VFD retrofits typically pay back in 1–3 years, while also reducing system stress and providing soft starting and surge protection.
Piping System Improvements
Reducing friction losses: adding a parallel line can raise flow by about 1.6 times (2 times in theory) or cut losses by about 60% at the same flow; friction loss is inversely proportional to the fifth power of pipe diameter, so one size larger cuts losses by about 50%; smooth linings lower the friction factor and reduce losses by 20%–40%.
Fitting optimization: long-radius elbows lose about 50% less than standard elbows; use tapered reducers and expanders instead of sudden contractions and expansions; for isolation duty, gate or ball valves in place of globe valves cut losses by 80%–90%.
Inlet conditions: keep at least 5–10 pipe diameters of straight pipe upstream of the pump inlet to reduce swirl and pre-rotation; a flow straightener that removes swirl can raise pump efficiency by 1%–2%.
Heat Exchanger Optimization
Fouling Management
Deposits on heat transfer surfaces can lower the overall heat transfer coefficient by 20%–50%, raise pressure drop and pumping power, and reduce duty so that equipment is forced to run away from design conditions.
Cleaning methods: mechanical cleaning such as tube brushing or high-pressure water jetting during shutdowns; chemical cleaning by circulating cleaning solution online; automatic ball cleaning systems for continuously operating units.
Fouling prevention: filter upstream to remove fouling precursors; keep velocity above 2 m/s to reduce deposition; choose materials such as titanium or high-nickel alloys that resist fouling better than carbon steel; apply fluoropolymer or ceramic coatings to reduce adhesion.
Design Optimization
Adjusting baffle spacing: closer spacing increases turbulence and heat transfer but raises pressure drop; wider spacing lowers pressure drop but also reduces heat transfer. The key is to balance better heat transfer against higher pumping costs.
Tube-side optimization: tube inserts such as twisted tapes or wire coils increase turbulence and can raise heat transfer by 20%–40%; internally finned or enhanced-surface tubes raise the heat transfer coefficient; multi-pass arrangements optimize velocity.
Valve and Control Optimization
Control Valve Sizing
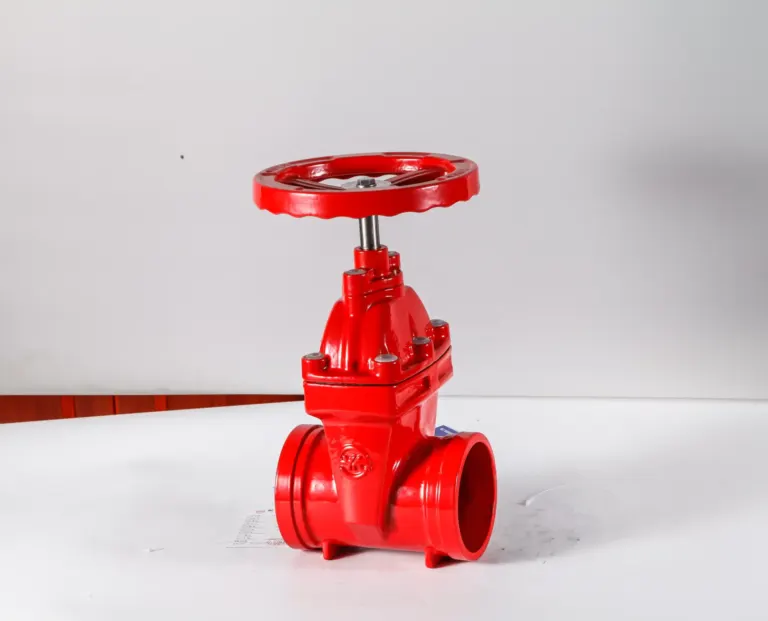
An oversized control valve spends long periods close to the closed position, which causes poor control, hunting and premature wear from high velocity; an undersized valve cannot pass the required flow even when fully open.
Optimization measures include rechecking the Cv calculation against actual conditions, fitting reduced trim in an oversized body to improve control, or replacing the valve with one sized for current conditions.
Control Loop Tuning
PID optimization must balance response and stability: higher proportional (P) gain gives tighter control but must avoid instability; integral (I) action removes offset but must be protected against windup; derivative (D) action improves response to fast changes but amplifies noise.
Advanced control strategies include cascade control with a fast inner loop and slow outer loop; feedforward control that compensates for disturbances in advance instead of reacting to them; and model predictive control that optimizes across interacting loops.
Valve Upgrades
In many applications, V-port ball valves and rotary control valves have lower friction than globe control valves; smart digital positioners with diagnostics can further improve response.
Condition-Based Maintenance
Predictive Maintenance
Vibration analysis: monthly or continuous monitoring finds unbalance before it causes failure, identifies bearing defects early for planned replacement and reveals misalignment.
Oil analysis: quarterly sampling detects bearing wear through metal particles, identifies contamination that needs action and shows whether the lubricant needs changing.
Infrared thermography: quarterly surveys track bearing temperature trends, find electrical hot spots and verify process temperatures.
Condition-based maintenance prevents unexpected failures and emergency repairs, times maintenance so it is neither too early nor too late, and stops equipment from running inefficiently with degraded parts.
Performance Testing
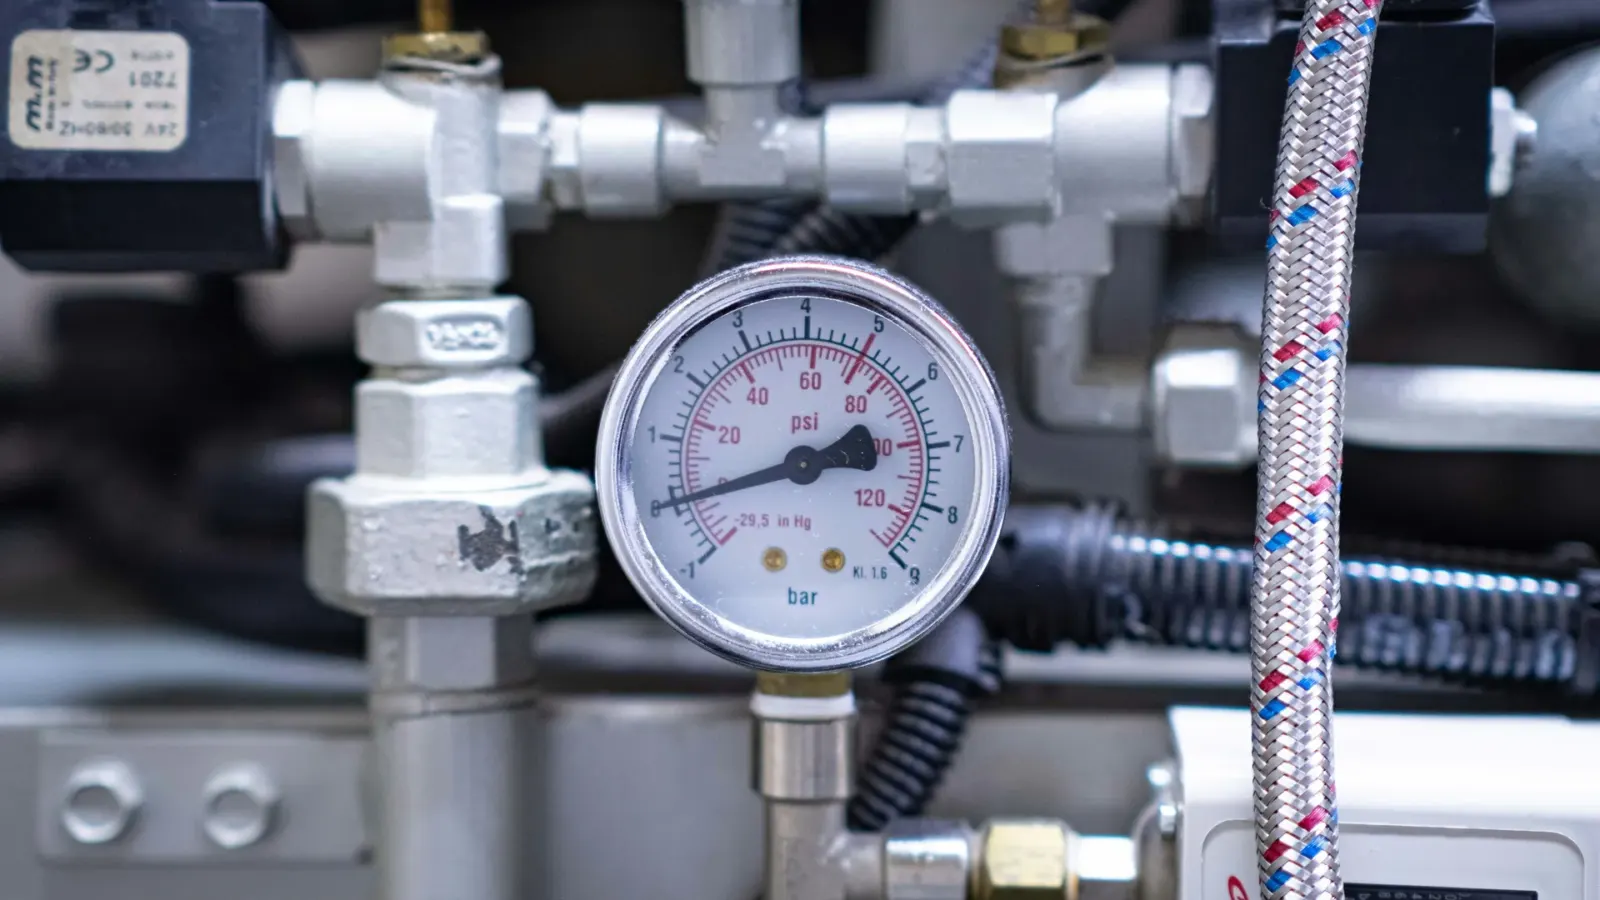
Every quarter or half year, measure flow, pressure and power at the same operating point, calculate efficiency and compare it with the baseline. A drop in efficiency of 5% or more should trigger an investigation.
Root cause investigation usually focuses on four areas: internal wear of impellers, wear rings and similar parts; fouling or deposits; increased drag from seals or bearings; and system changes that raise resistance.
Energy Management
Motors and Power Quality
Motor efficiency: IE3/IE4 high-efficiency motors use 2%–5% less energy than standard motors; motors should be sized to run at 75%–100% of rated load; power factor correction with capacitors reduces reactive power charges.
The role of VFDs: they eliminate throttling losses at part load, keep the power factor close to 1 across loads, and provide soft starting that reduces inrush current and mechanical stress.
System Efficiency Analysis
Assess overall system efficiency, not just the efficiency of individual units: η_system = η_pump × η_motor × η_drive × (1 − throttling losses).
Typical optimization priorities:
- Eliminate throttling: biggest impact, moderate cost.
- Optimize the operating point: large impact, low to moderate cost.
- Upgrade equipment: moderate impact, higher cost.
- Redesign the system: large potential impact, highest cost.
Energy Monitoring
Continuous monitoring systems track energy use per unit of output in real time, compare it with baselines or targets, raise automatic alarms on deviations and reveal optimization opportunities through historical trends. Benchmarks can include past performance, similar systems in the same plant, industry best practice and the theoretical minimum energy use.
Conclusion
Equipment performance optimization delivers solid returns through energy savings, higher output and better reliability, while deferring capital replacement. Combining baselines, performance monitoring, targeted improvements and continuous optimization is what keeps equipment in top condition throughout its life.
If you are sourcing pumps, valves or related equipment for a project, send KFE your equipment list and operating data and we will help with selection and quotation.
Related industry: Metals & Power Generation